Global Data, Reporting, and Analysis
ARiVADATA provides insights on all phases of flight so you can identify constraints, analyze past performance, and improve your daily operations.
ARiVADATA is your one-stop shop for all of your data needs. We offer unmatched fused data from over 44 different sources including global satellite ADS-B from Aireon, 50,000 global terrestrial ADS-B sensors, FAA SWIM, and global real-time flight milestones (flight events).
Airports
Airports
Learn MoreAirlines
Airlines
Learn MoreBusiness Aviation
Business Aviation
Learn MoreGlobal Data Services
Global Data Services
Learn MoreBenefits
Global Data Fusion
Global Data Fusion
Exclusive Global Airfield Coverage
Reliability
Reliability
Scalability
Scalability
Interested in a personalized value assessment?
Benefits
Global Data Fusion
Global Data Fusion
Exclusive Global Airfield Coverage
Reliability
Reliability
Scalability
Scalability
Interested in a personalized value assessment?
Pick the Solution that Best Fits Your Needs
ARiVADATA provides a real-time feed for live operations and historical data for analysis through three product offerings: ARiVA Global Feed, Standardized Reports, and Customized Reports. ARiVADATA products are available as a standard data API compatible with existing third-party operations management systems, OR through the ARiVA visualization platform.
ARiVA Global Feed
Real-time aircraft positional tracking; real-time flight predictions; real-time flight events (live flight milestones). All are gate-to-gate and available in any region of the globe.
Standardized Reports
Pre-formatted, standardized reports covering a wide range of operational statistics – pushed daily, weekly, or monthly.
Customized Reports
Detailed insights into airfield operations, airborne operations, airport asset utilization, delays, turn times, and many other metrics. See a sampling of these reports below.
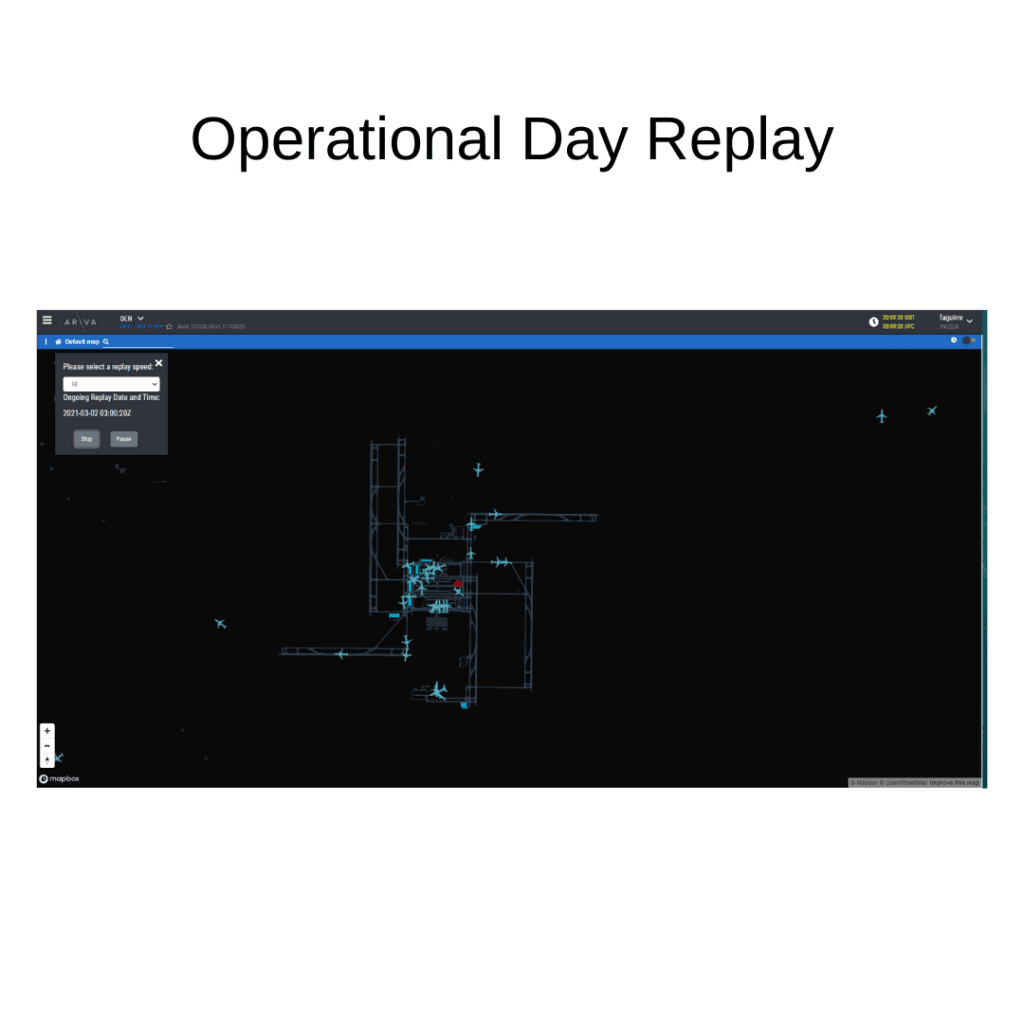
A visual report including a screen recording of a past operational event in the air or on the ground, along with insights, analysis and recommendations from our subject matter experts.
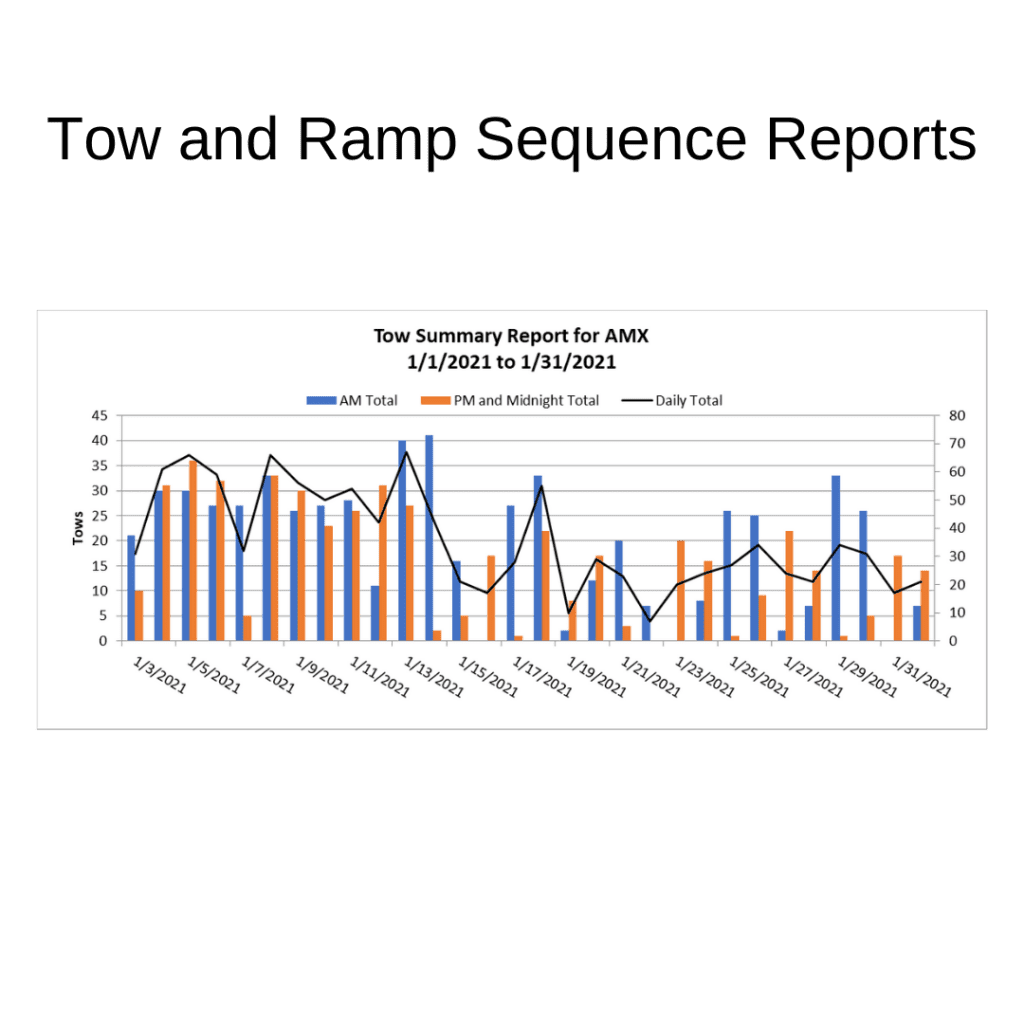
Analyze all tow and ramp activity by date, time of day, gate, aircraft type, tow crew, etc. Use example: determine wait time between a tow requested and tow completed.
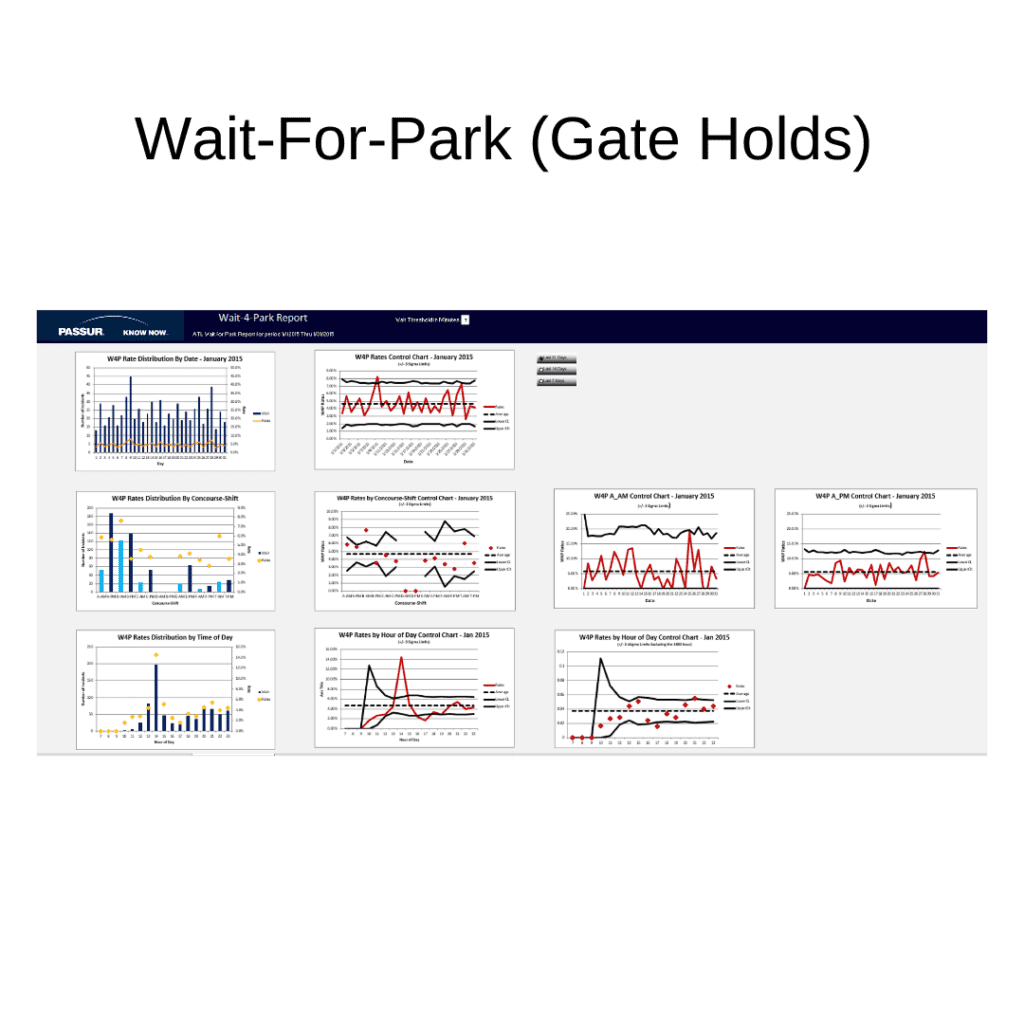
Determine wait-for-park times for individual arriving flights, or across gates, concourses, or work shifts, over different intervals of time.
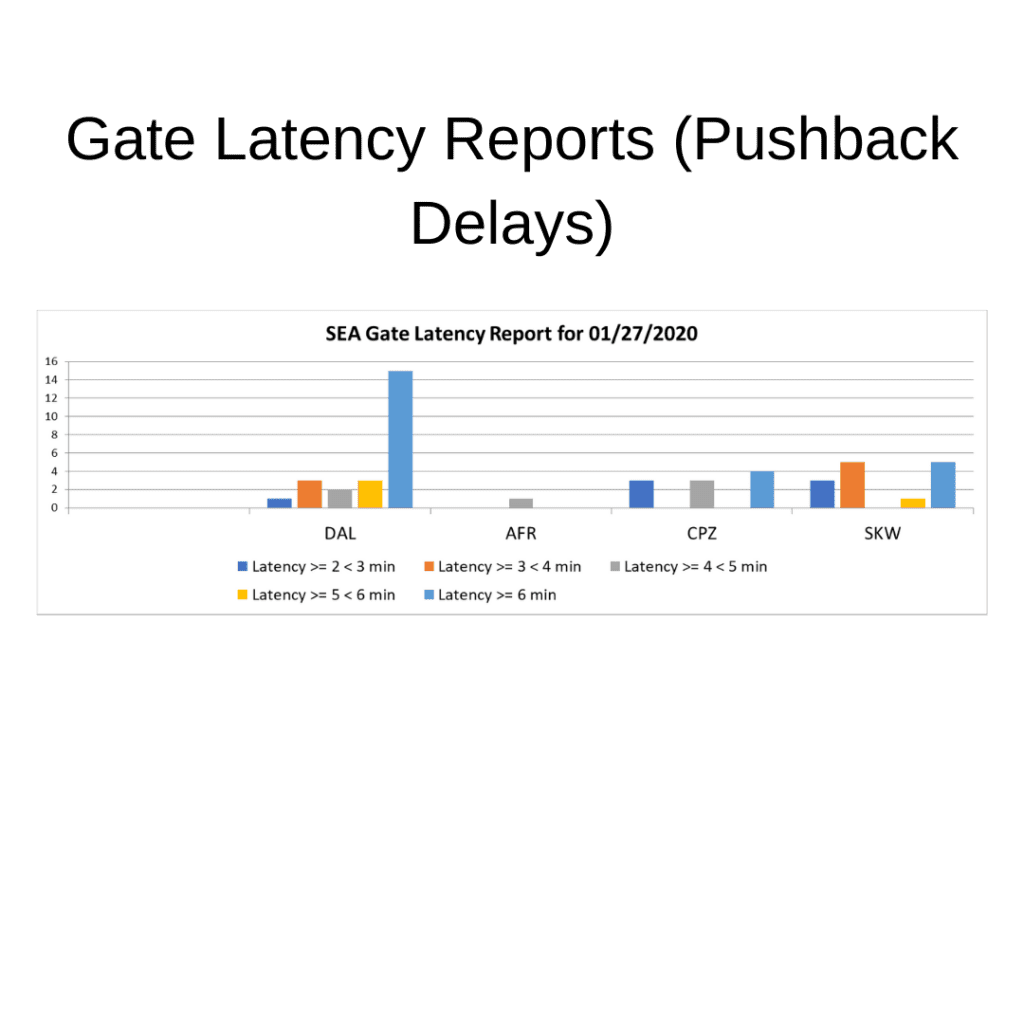
Find root causes for delays at gate pushback. Use example: determine latency by carrier, concourse, time of day (shift), etc.
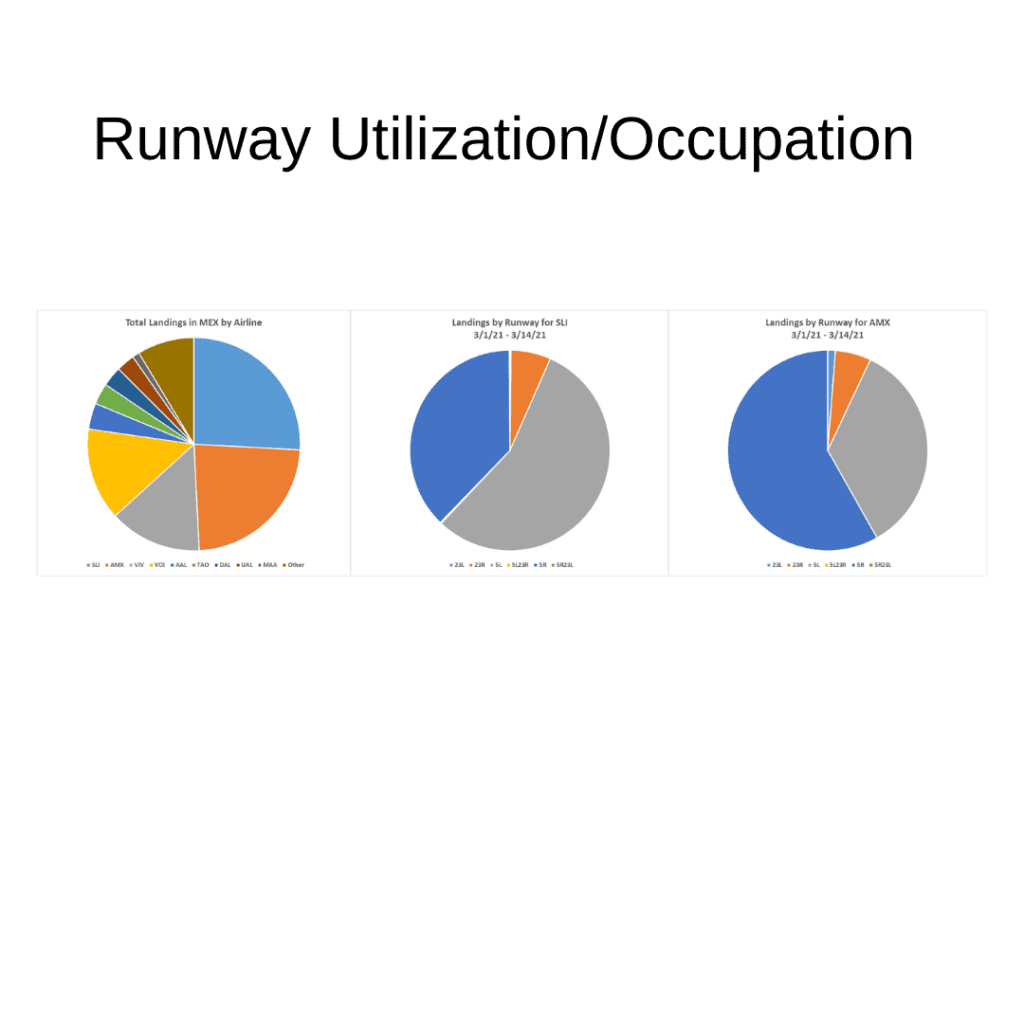
Explore runway utilization by airline as well as expected queue and wait times by day. Use example: Planned single engine taxi departures and/or hold selected departures on gates during strategic periods of time.
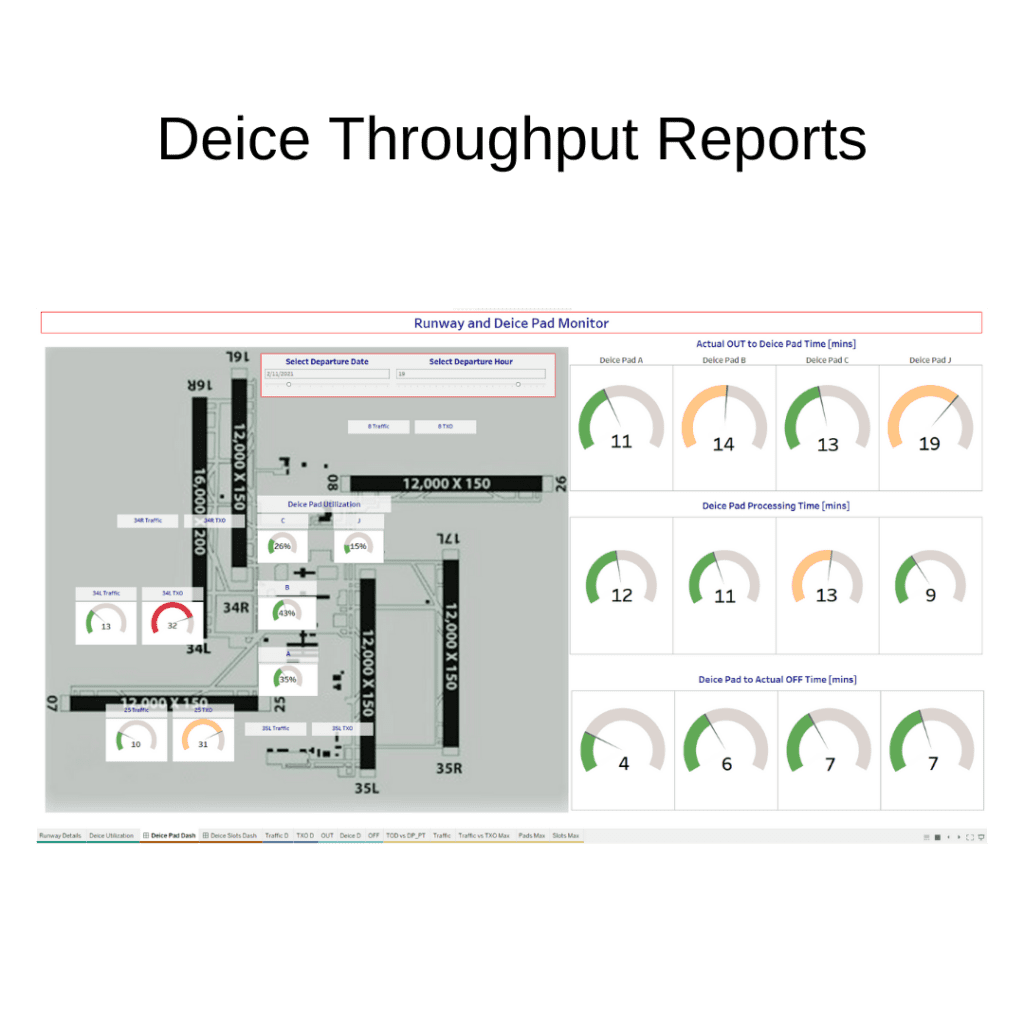
Plan the next winter event with confidence with accurate operational metrics such as time from gate to deice pad, deicing processing times, and time from deice pad to take off.
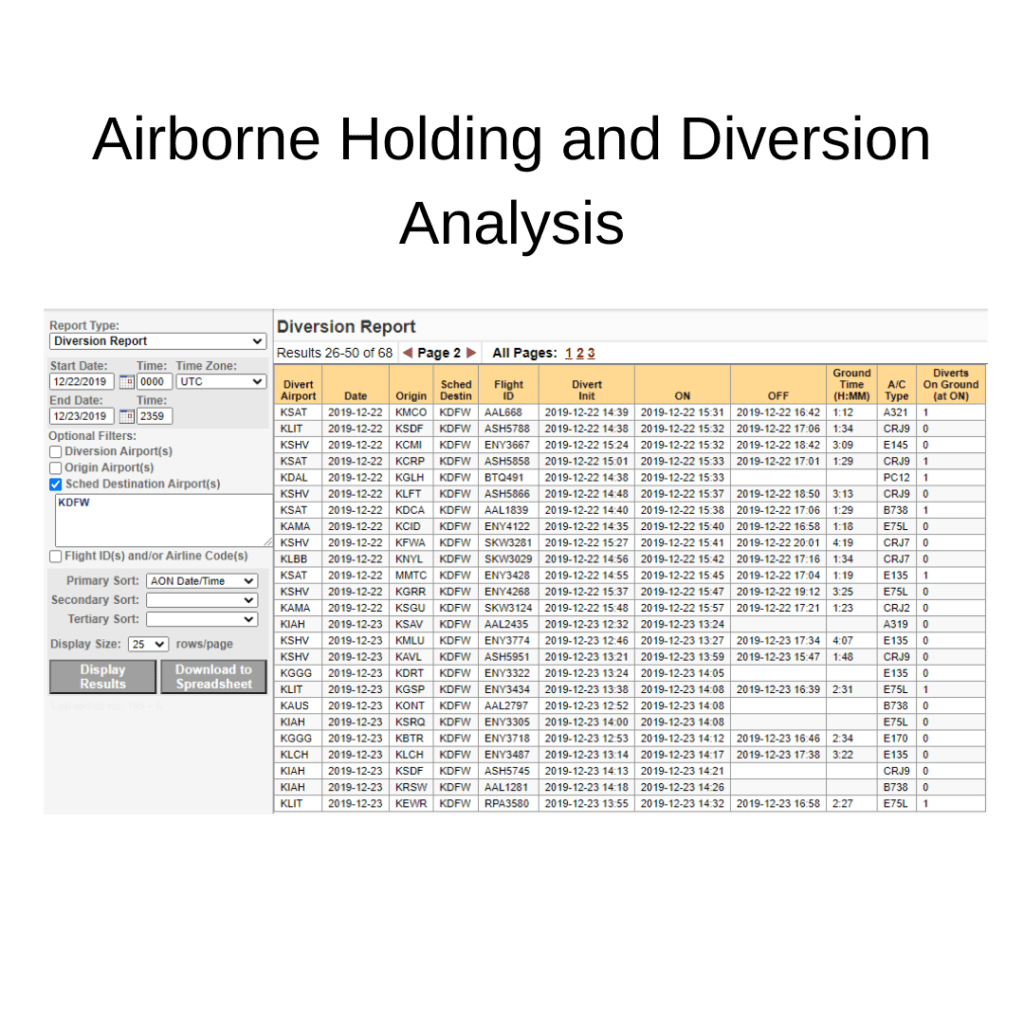
Quantify and measure all holding and diversion events to improve mitigation strategies. Use example: Measure average added time to schedule by diverted airport.
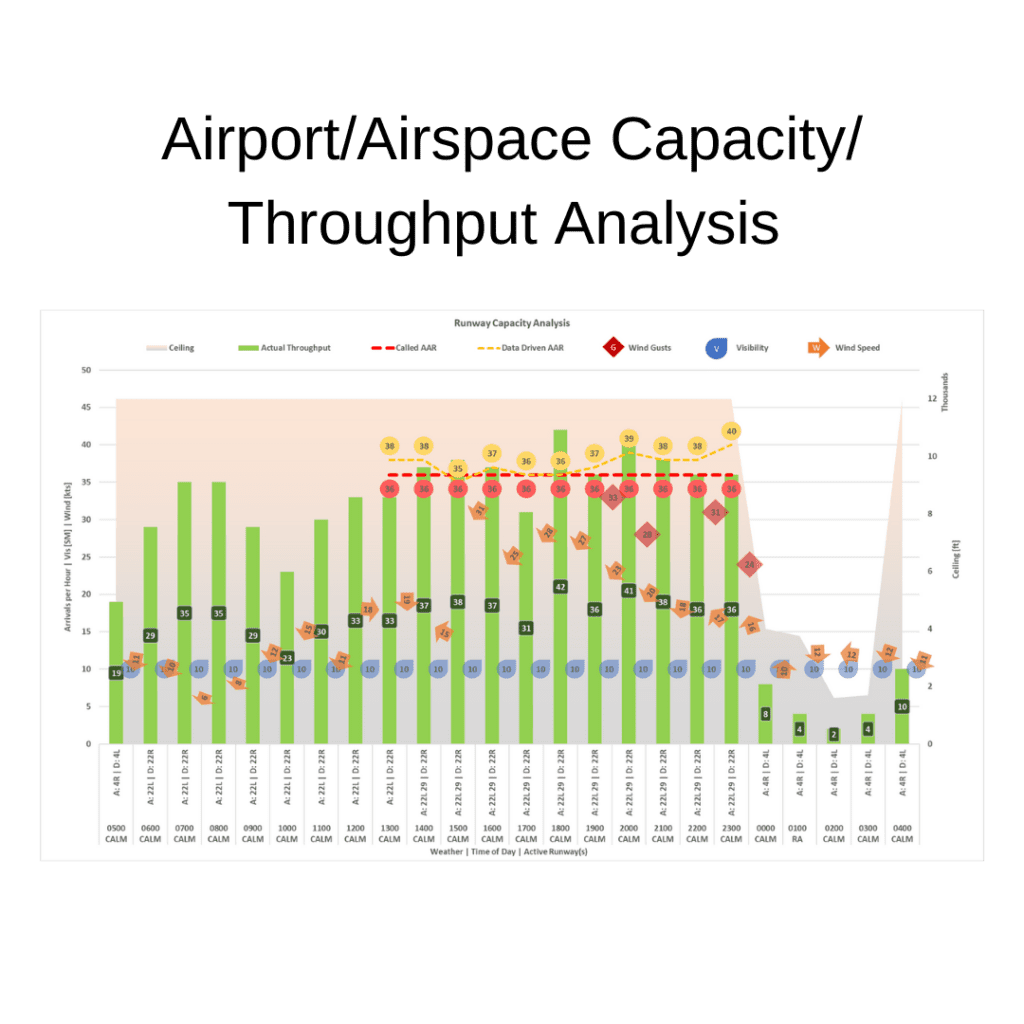
Examine the impact to throughput based on day, time of day, weather, and/or runway configuration. Assess performance across ANSP delays such as Ground Delay Programs (GDPs) or ATFM En-Route Delay.
ARiVA Global Feed
Real-time aircraft positional tracking; real-time flight predictions; real-time flight events (live flight milestones). All are gate-to-gate and available in any region of the globe.
Standardized Reports
Pre-formatted, standardized reports covering a wide range of operational statistics – pushed daily, weekly, or monthly.
Customized Reports
Detailed insights into airfield operations, airborne operations, airport asset utilization, delays, turn times, and many other metrics. See a sampling of these reports below.
Get a Rapid Quote
Build your own report by requesting data needed for your specific purposes.
Complete our Rapid Quote Form and receive a quote in less than 24 business hours.
Get a Rapid Quote
Build your own report by requesting data needed for your specific purposes. Complete our Rapid Quote Form and receive a quote in less than 24 business hours.